
The circulation of checked out books and media transforms the library into a data exchange center. This flow of information can be calculated mathematically, analyzed statistically and represented visually. From a cultural perspective, the result may be a good indicator of what the community of patrons considers interesting information at any specific time. Visualizing the statistical information of the titles and their categories therefore provides a real-time living picture of what the community is thinking.
“Making Visible the Invisible” is an installation consisting of 6 large LCD screens located on a glass wall horizontally behind the librarians’ main information desk in the Mixing Chamber of the Seattle Central Library, a large open 19,500 sq ft space dedicated to information retrieval and public accessible computer research.
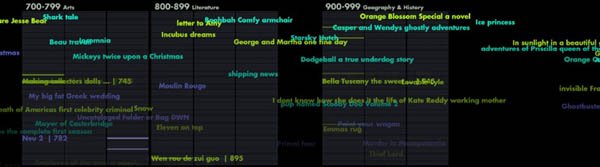
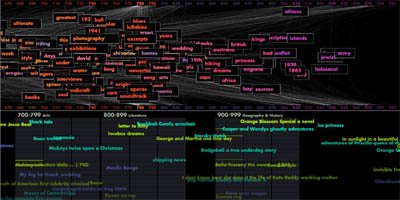
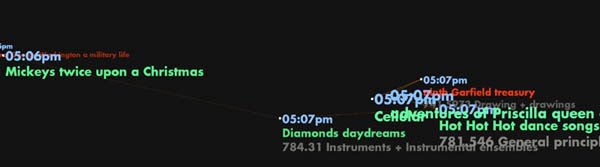
The screens feature real-time calculated animation visualizations generated by custom designed statistical and algorithmic software using data received each hour. This data consists of a list of checked-out items organized in chronological order. The item may be a book, a DVD, a CD, a VHS tape, etc. and from the list we can collect and aggregate titles, checkout time, catalog descriptors such as keywords, Dewey classification code if they are non-fiction items. There are approximately 36000 items circulating per day. Items with Dewey Decimal System labels provide for a way to get a perspective on what subject matters are of current interest at any given time as the Dewey system classifies all items according to 10 major categories: 000 Generalities; 100 Philosophy & Psychology; 200 Religion; 300 Social Science; 400 Language; 500 Natural Science & Mathematics; 600 Technology & Applied Sciences; 700 Arts; 800 Literature; 900 Geography & History. These are then subdivided into 100 segments. There are 4 visualizations at this time.
No comments:
Post a Comment